V Solutions
- Power Plant Monitoring
- Online Banking Integration
- POS Transaction Integration
- IFRS Compliance Package
- Resource Planning
- Advanced Maintenance & Repair Application
- Enriched MT940
- Financial Enhancements
- Warehouse Management Mobile Screens
- Content and Product Management
- Imports Application
- Vira Service Field Application
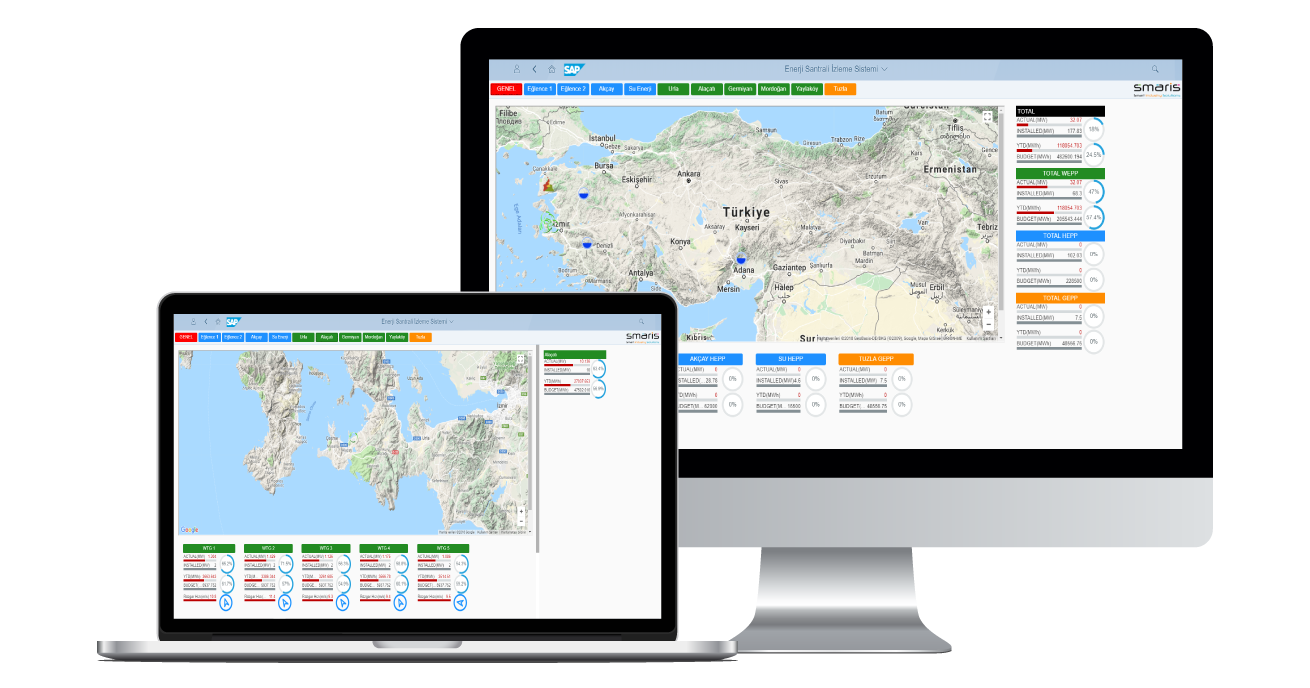
Power Plant Monitoring
Vektora’s Plant Monitoring application has been developed to work in integration with mobile devices and SAP Gui screens to manage and generate reporting of all power plants on a single screen with accurate data in an easier and more functional manner.
The user can see all the power plants on the screen via Google maps as well as the turbines in those power plants. The data of each power plant is updated instantly and automatically on the screen and the transitions between the power plants can be easily monitored. The functional cockpit display has also been developed as a product to see the location of each plant on the map and track the KPI values.
SOLUTION FEATURES
- Displaying the locations on the Power Plant Monitoring cockpit via Google maps app based on the type of power plant and relevant data updated at regular intervals.
- Google maps is used as map and this library is integrated into Fiori.
- Using the Google maps library, specific locations on the map are displayed with animated images and certain ratios related to these locations can be viewed in detail by zooming in.
- KPI objects within the SAP ui5 library are used. These charts are filled with specific values and reports are generated.
- Information such as weather, wind speed, etc. are read from any external service and displayed on the screen with Google maps features.
- The screen has a responsive design for tablet, computer and television screens.
- Each KPI image on the screen is read from the service and refreshed every 15 seconds.
- Data captured via IoT sensors are instantly displayed on this screen.
- Using the wind direction data, the dynamic image of wind direction is displayed on the screen with updates according to incoming data.